

- Pulley Lagging
- QUICK LINKS
- Lagging Types Overview
- Product overview
- Lagging Select – Analysis Tool
- Lagging Analyst
- Pulley Lagging Specifications
- NAT v’s FRAS Overview
- Hot v’s Cold Bonding
- Large Lagging Rolls
- Pulley Lagging News
- Pulley Lagging Case Studies
- Storage Recommendations
- Material Safety Data Sheets
- Installations & Applicators
- Wear Panels
- About Us
- Case Studies
- LATEST CASE STUDIES & TECHNICAL PAPERS
- Technical Papers
- Technical Papers
- News
- LATEST NEWS
- MATERIAL SAFETY DATA SHEET
- MSDS Cold Bond Adhesive
- MSDS Cold Bond Adhesive Hardener
- MSDS Metal Primer 2205
- MSDS Metal Primer 2207
- MSDS Direct Bond Adhesive – Part A
- MSDS Direct Bond Adhesive – Part B
- MSDS Hot Vulcanised Brushing Cement
- MSDS Hot Vulcanised Lagging Adhesive
- MSDS High Temperature Direct Bond Adhesive Resin
- MSDS High Temperature Direct Bond Adhesive Hardener
- Elastotec Dangerous Goods Packing Details
- MATERIAL SAFETY DATA SHEET
- Partner Login
- APPLICATION
- Cold Bonded Lagging Application Procedure Steps
- Cold Bonded Ceramic Lagging Checklist
- Hot Vulcanised Application Procedure Steps
- Hot Vulcanised Ceramic Lagging Checklist
- Direct Bond Ceramic Pulley Lagging Application Procedure
- Direct Bond Ceramic Pulley Lagging Rolls <300mm
- Direct Bond Ceramic Lagging Checklist
- APPLICATION
- Contact

Pulley Lagging Selection and Performance Optimisation
Abstract
In belt conveying, pulley lagging is the source of necessary friction for power transfer. The constant need to transfer bulk materials at higher rates over longer distances has resulted in a requirement to transfer more power through the drive pulley. Despite these changes, conveyor design standards (ISO5048, DIN22101, CEMA) continue to utilise the over-simplified rope friction model (Euler’s equation) to determine power transfer limits. The primary, well-known limitation of this model lies in the assumption of a constant coefficient of friction around the lagging surface that is fully developed. Recent research has demonstrated that the friction between the lagging and belt bottom cover varies with factors such as wrap pressure and speed, resulting in a misrepresentation of the behaviour in the interphase and, consequently, inadequate design of the belt conveyor system.
Pulley lagging has historically been treated as a consumable and replaced when worn or damaged. No standardised method is available to select a suitable lagging, with lagging selection typically based on industry best practices or previous experience. When coupled with the requirement for increased power transfer, this results in unplanned lagging failure, increased plant downtime and lost production.
This paper presents the development of a software tool that provides a detailed engineering analysis for lagging selection and performance. This tool calculates the normal pressure, shear stress, developed friction and presence of localised belt slippage (if any) at each point of the belt wrap. The tool also calculates the stresses generated at various locations inside the lagging and maps the generated stresses against the fatigue limits of the lagging at different locations. By understanding the applied loads and limitations of each lagging type, selection becomes an ‘engineered’ decision, minimising failures and downtime.
1. Introduction
A belt conveyor operates due to the friction force generated between the drive pulley and the belt. Belt tension provides the required normal force to generate sufficient friction force. Tight side belt tension (T1) is typically load and resistance dependent, whereas slack side tension (T2) is maintained by a take-up system to avoid slip at the drive [1, 2]. The difference between these two tensions (T1-T2) is called effective tension (Te), and it is the magnitude of the force required to drive the belt conveyor [1]. This force is generated by the drive pulley and transferred to the belt through the lagging in the form of a frictional force between the lagging and belt bottom cover.
Advanced material technology leads to lighter belts, which are able to handle similar tensions and high revolutions per minute. Lighter belts permit small pulley diameters with the same tension requirement to the drive shaft [3]. When sufficient friction force cannot be generated to match the value of Te, the drive system encounters slip. Different methods can be adopted to stop the slippage in the system. Some of the methods can be to use speciality lagging, increasing the wrap angle by using a snub pulley, adjusting effective tension, and changing the pulley size [1, 4]. The maximum available friction force on the drive pulley decides the production output of the conveyor system. Hence, lagging friction properties becomes extremely important in deciding the conveyor design parameters [5].
When a belt conveyor operates, the pulley is constantly under dynamic load, and all the components of the pulley go through cyclic stresses due to this load; this leads to fatigue in the pulley components [3]. Fatigue life is defined as the number of loading or stress cycles a component can sustain before failure [6]. If a component does not show a failure within ten million cycles, it can be assumed that the component is safe for an infinite number of cycles or it will sustain its recommended service life [6]. The fatigue life of a component can also be understood as the life of the component to generate and propagate a crack. The fatigue life depends on the magnitude of the loading, and it is well known that crack initiation requires more loading magnitude than crack propagation [6]. Hence, if a component operates below the crack initiating loading magnitude, it is safe to assume that it will operate for an infinite number of cycles. The same fatigue life principles apply to pulley lagging.
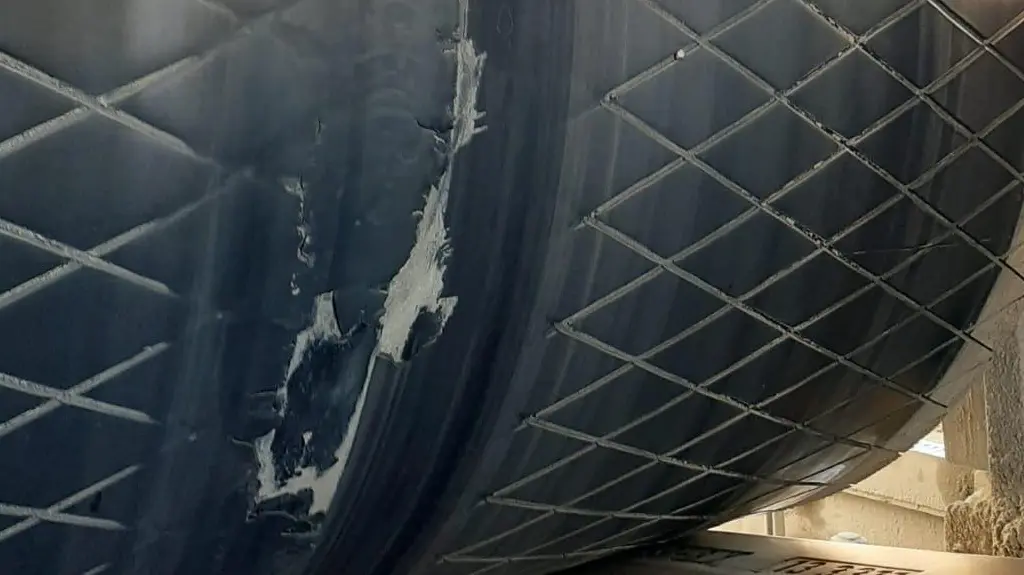
Repeated pulley lagging failures had been observed on the drive and non-drive high-tension bend pulleys. A few common observations were debonding of the lagging from the pulley shell (as shown in Figure 1). Belt cover wear (as shown in Figure 2) and lagging fatigue failure (as shown in Figure 3). Unplanned lagging replacement due to failure may lead to major financial loss in production output and belt damage.


The two main reasons for these failures are due to the following knowledge gaps –
- The actual coefficient of friction (CoF) between the belt and lagging around the pulley wrap is still unknown. The value of CoF considered for designing the belt conveyors is constant and mostly conservative. Neither the factors that influence the coefficient of friction are well-defined, nor is their influence quantified.
- Fatigue limits of the lagging material and bonding system are not identified. Also, there is no mechanism available to map the generated fatigue in a lagging during application against fatigue limits of the lagging at its various locations.
2.1 Friction Testing
It is well-known that the friction coefficient is not constant around the wrap of the pulley, and it does not follow the classical friction behaviour referred to as a variant friction model [5]. Factors such as different belt and lagging combinations, normal pressure (T1 and T2 dependent), ambient temperature, and velocity also affect the coefficient of friction. Hence, the friction coefficient between a belt and lagging is a complex parameter to define, and its relationship with different factors affecting the coefficient of friction is also unknown.
The friction experiments on Elastotec’s Rubber and Ceramic laggings with Grade M/Global X belt samples have been performed in The University of Newcastle research facility to identify the coefficient of friction between the belt bottom cover and lagging. The preliminary results of friction experiments are shown in Figures 4 and 5. The equipment measures the friction force with the displacement of the belt sample pressed against the lagging sample. Five different face pressures have been applied to measure friction force with displacement. The normal force is calculated by multiplying face pressure with the area of the lagging sample in contact with the belt. The friction force is divided by the normal force to calculate the coefficient of friction. Figures 4 and 5 suggest different coefficients of friction for different normal forces and displacements. The coefficient of friction values increases with displacement and keeps increasing after a localised slip is initiated (visual observation) and reaches to a maximum value. This behaviour of the coefficient of friction is a violation of classical friction theory. The value of CoF remains almost constant after a certain displacement. CoF’s value was found to be higher for lower face pressure.
This paper does not detail the friction experiments but only consists of preliminary friction results for natural and medium ceramic lagging, and a separate paper will be presented on friction testing.


These friction values are used in the software tool to estimate localised slip between the belt and lagging as a function of normal pressure and contact shear stress.
2.2 Fatigue Limits
The combination of normal pressure and contact shear stress applied results in internal shear stress developed in the pulley lagging, which is dependent on the lagging design, specifically material properties and geometry.
To quantify the performance of the pulley lagging design under varying normal pressure and surface shear stress, Finite Element Analysis (FEA) is used to define the envelope of operation that satisfies the design criteria chosen. The FEA method predicted the shear stress developed:
- Internally in the pulley lagging rubber
- At the interface with the pulley steel shell, ceramic tile interface (where applicable) and
- At the contact interface with the conveyor belt.
The fatigue life of the lagging rubber can be quantified as a function of the rubber shear stress. A phenomenological relationship between rubber shear stress versus fatigue life based on a library of test data has been developed by Conveyor Dynamics. On the basis of a typical conveyor pulley rotational speed of 60 rpm and a minimum rubber fatigue life of 5 years of operation at 90% utilisation, it is estimated that the pulley lagging will be subjected to approximately 1.4×10^8 cycles. The developed relationship has been applied to determine the maximum allowable rubber shear stress to achieve the required fatigue life of 5 years. It is assumed that the maximum allowable shear stress at the interface between the lagging rubber and both the pulley steel shell and ceramic tiles (where applicable) is similar on the basis that full bond strength is achieved. These maximum allowable shear stress values are used in the software tool to map the safe application area for each lagging product.
2.3 lagging select – performance optimisation tool
Elastotec Australia, in collaboration with Conveyor Dynamics Inc. (CDI), has developed a novel lagging analysis tool called Lagging Select to quantify the complex interaction between the belt and the pulley lagging for both drive and non-drive applications.
The tool has two sets of output in graphical and statistical form. The first graphical output of the tool determines the probability and magnitude of localised slip between the belt and lagging. It predicts localised slip by evaluating the maximum available traction around the pulley wrap by utilising the variant friction results as explained in section 2.1 and comparing this maximum available traction with the developed traction by using conveyor design parameters. When the developed traction or traction demand exceeds the maximum available traction, then localized slip is predicted. The tool predicts localized slip for dry and wet/dirty environmental conditions separately. The first statistical output provides the value of maximum shear stress developed in the lagging and the minimum required value of T2 to eliminate.
In Figure 6, which is the first output of the tool, the dotted red and green lines represent traction limits in dry and wet/dirty environmental conditions, respectively using the variant friction model. The solid red line represents developed traction or traction requirement. As this graph is for dry environmental conditions, before the 187 wrap angle, the demanded traction is less than the maximum available traction, and consequently, there is no localized slip expected. When the application crosses 187° wrap angle, the traction demand exceeds the maximum available value, and localized slip is expected.

The second output of the tool, shown in Figure 8, defines the fatigue limits against average shear stress and normal pressure applied on the lagging. Figure 7 shows the location of the same fatigue limit lines on the lagging. Four different types of fatigue limit lines are produced – contact face limit (fatigue limit at the surface of the lagging in contact with the belt), tread root limit (fatigue limit at the base of the lagging profile, level with the grooves/sipes of the lagging), pulley shell limit (fatigue limit of the bonding between the lagging and pulley shell), and tile bond limit (fatigue limit of the bonding between the tile and rubber), as shown in Figures 7 and 8. The tile bond limit is only applicable in case of ceramic lagging.

Figure 7 Fatigue Limits Locations on the Lagging

The tool calculates the normal pressure and shear stress at every wrap angle of the application based on the belt conveyor design parameters and plots the application line. If the application line on the graph falls outside the fatigue limits, it is an indication that the application is not suitable, and there may be a risk of lagging premature failure. Therefore, the application line should always fall inside the fatigue limit lines or, in other words, inside the safe operating envelope.
In Figure 8, solid orange, blue, and yellow lines are the tread root, contact face, and pulley shell fatigue limit lines, respectively. The coloured dotted lines are reflected in Figure 7 to visualise the locations of these fatigue limits on the lagging. Figure 8 is an example graph for diamond lagging; hence tile bond fatigue limit line is not plotted in this graph. In Figure 8, the safe zone is highlighted by the green colour, and the application is outside the safe envelope because it exceeds the tread root fatigue limit line. This indicates that the lagging is expected to fail prematurely in the tread root area.
Case study
One of Elastotec’s customers faced an issue of pulley lagging failure in the year 2021. The customer is based in Australia, and the conveyor is running in a gold mining operation. The customer upgraded the conveyor design to increase production output from 4600 TPH to 5150 TPH. For this upgrade, the belt specification has been changed from ST-5600 to ST-6300 due to the higher belt tensions.
At that point in time, there was no engineering analysis available to verify lagging selection in terms of fatigue life. Based on past experience, the customer assumed that the same lagging, which was used before the upgrade, could cope with the upgraded specifications. Hence, the same lagging was applied with the upgraded conveyor specifications.
Within four weeks of the conveyor operation, a catastrophic pulley lagging failure happened. It was a dual-drive conveyor system, and failure happened in both the drive pulleys. Figures 9 and 10 show the failures that occurred on both the drive pulley laggings.


The customer contacted Elastotec to identify the root cause of the failure. Elastotec performed an analysis to identify if there is a probability of slip between the belt and the lagging, which may have caused this failure. There was no slip issue found with this conveyor design.
Elastotec and Conveyor Dynamics started a project to analyse the root cause of this failure and found out that the reason for this failure was excessive stresses developed in the lagging, which crossed the fatigue limit at the tread root location. It can be seen in Figure 9 that the lagging was damaged from the tread root location. The current Lagging Select tool has been developed based on the analysis methodology evolved in this case study. The analysis has not only identified the root cause of failure but also suggested the best suitable lagging for the upgraded conveyor design parameters. Figures 10 and 11 show the lagging failure and its corresponding envelope, and Figures 12 and 13 show the grooved Herringbone pattern lagging and its envelope.
It is clear from the performance envelope of Figure 11 that the failed lagging was operating outside the safe zone, and the application exceeds the tread root fatigue limit, consequently, the lagging failed from the tread root location. Whereas, for the herringbone pattern lagging, the performance envelope is significantly greater, and hence the lagging started operating mostly or very near within the safe zone. The belt conveyor has been operating with the herringbone lagging design since October 2021 without any sign of lagging damage.


Figure 11 Performance Envelope for Failed Lagging


Lagging Select tool has been applied to many different existing belt conveyor designs under various conditions to validate the analysis. The tool has always predicted issues found with existing lagging failures and made recommendations for suitable lagging replacement. The tool is still being upgraded to address the influence of different variables, such as temperature and lagging-belt combinations and to include additional design features, such as solid woven belts etc. An online web-based version of the tool is also being developed and will be available by the end of this year.
Conclusion
Partial knowledge regarding the coefficient of friction between the lagging and belt often leads to conservative belt conveyor design. Poor pulley lagging selection generates the risk of lagging failure and hence production loss and even damage to the conveyor belt. A software tool has been developed to predict the normal pressure, shear stress and localized slip between the belt and lagging and identify the safe zones for different laggings to operate. The variant friction model for different laggings and for varying normal pressure has been checked, and the software tool has been calibrated for Elastotec’s laggings. A phenomenological relationship between rubber shear stress versus fatigue life has been developed and applied to determine the maximum allowable rubber shear stress to achieve the required fatigue life. The fatigue life for bonding has been developed considering the maximum allowable shear stress at the interfaces. This forms the performance envelope of the tool and is considered a safe zone for lagging applications.
The tool also indicates the maximum shear stress developed in the lagging, minimum T2 requirement to prevent localized slip, and maximum allowable wear of belt lagging combination before the localized slip starts for a particular application.
The Lagging Select tool has been applied to a number of belt conveyor applications and has always shown accurate results. The tool can be utilised to select the best suitable lagging for an application, or it can be used to analyse the root cause of lagging failure. In some scenarios, the tool can indicate the future lagging issues that may occur, although there is no current sign of lagging damage; this issue can be addressed during preventive maintenance.
References
[1] Robinson, P.W., et al., Pouch conveyor drive system dynamics. International Journal of Mechanics and Materials in Design, 2021. 17(1): p. 187-199.
[2] 22101, D., Continuous conveyors—belt conveyors for loose bulk materials, basis for calculation and dimensioning. 2011: German Institute for Standardisation (DIN)
[3] Patel, N.R. and N.P. Joshi, conveyor pulley failure analysis. International Journal of Engineering Development and Research, 2014. 2: p. 445-447.
[4] He, D., et al., Healthy speed control of belt conveyors on conveying bulk materials. Powder Technology, 2018. 327: p. 408-419.
[5] Brett Devries, P., Variant Friction Coefficients of Lagging and Implications for Conveyor Design.
[6] Xin, Q., 2 – Durability and reliability in diesel engine system design, in Diesel Engine System Design, Q. Xin, Editor. 2013, Woodhead Publishing. p. 113-202.


